The AgileBrain 10 States
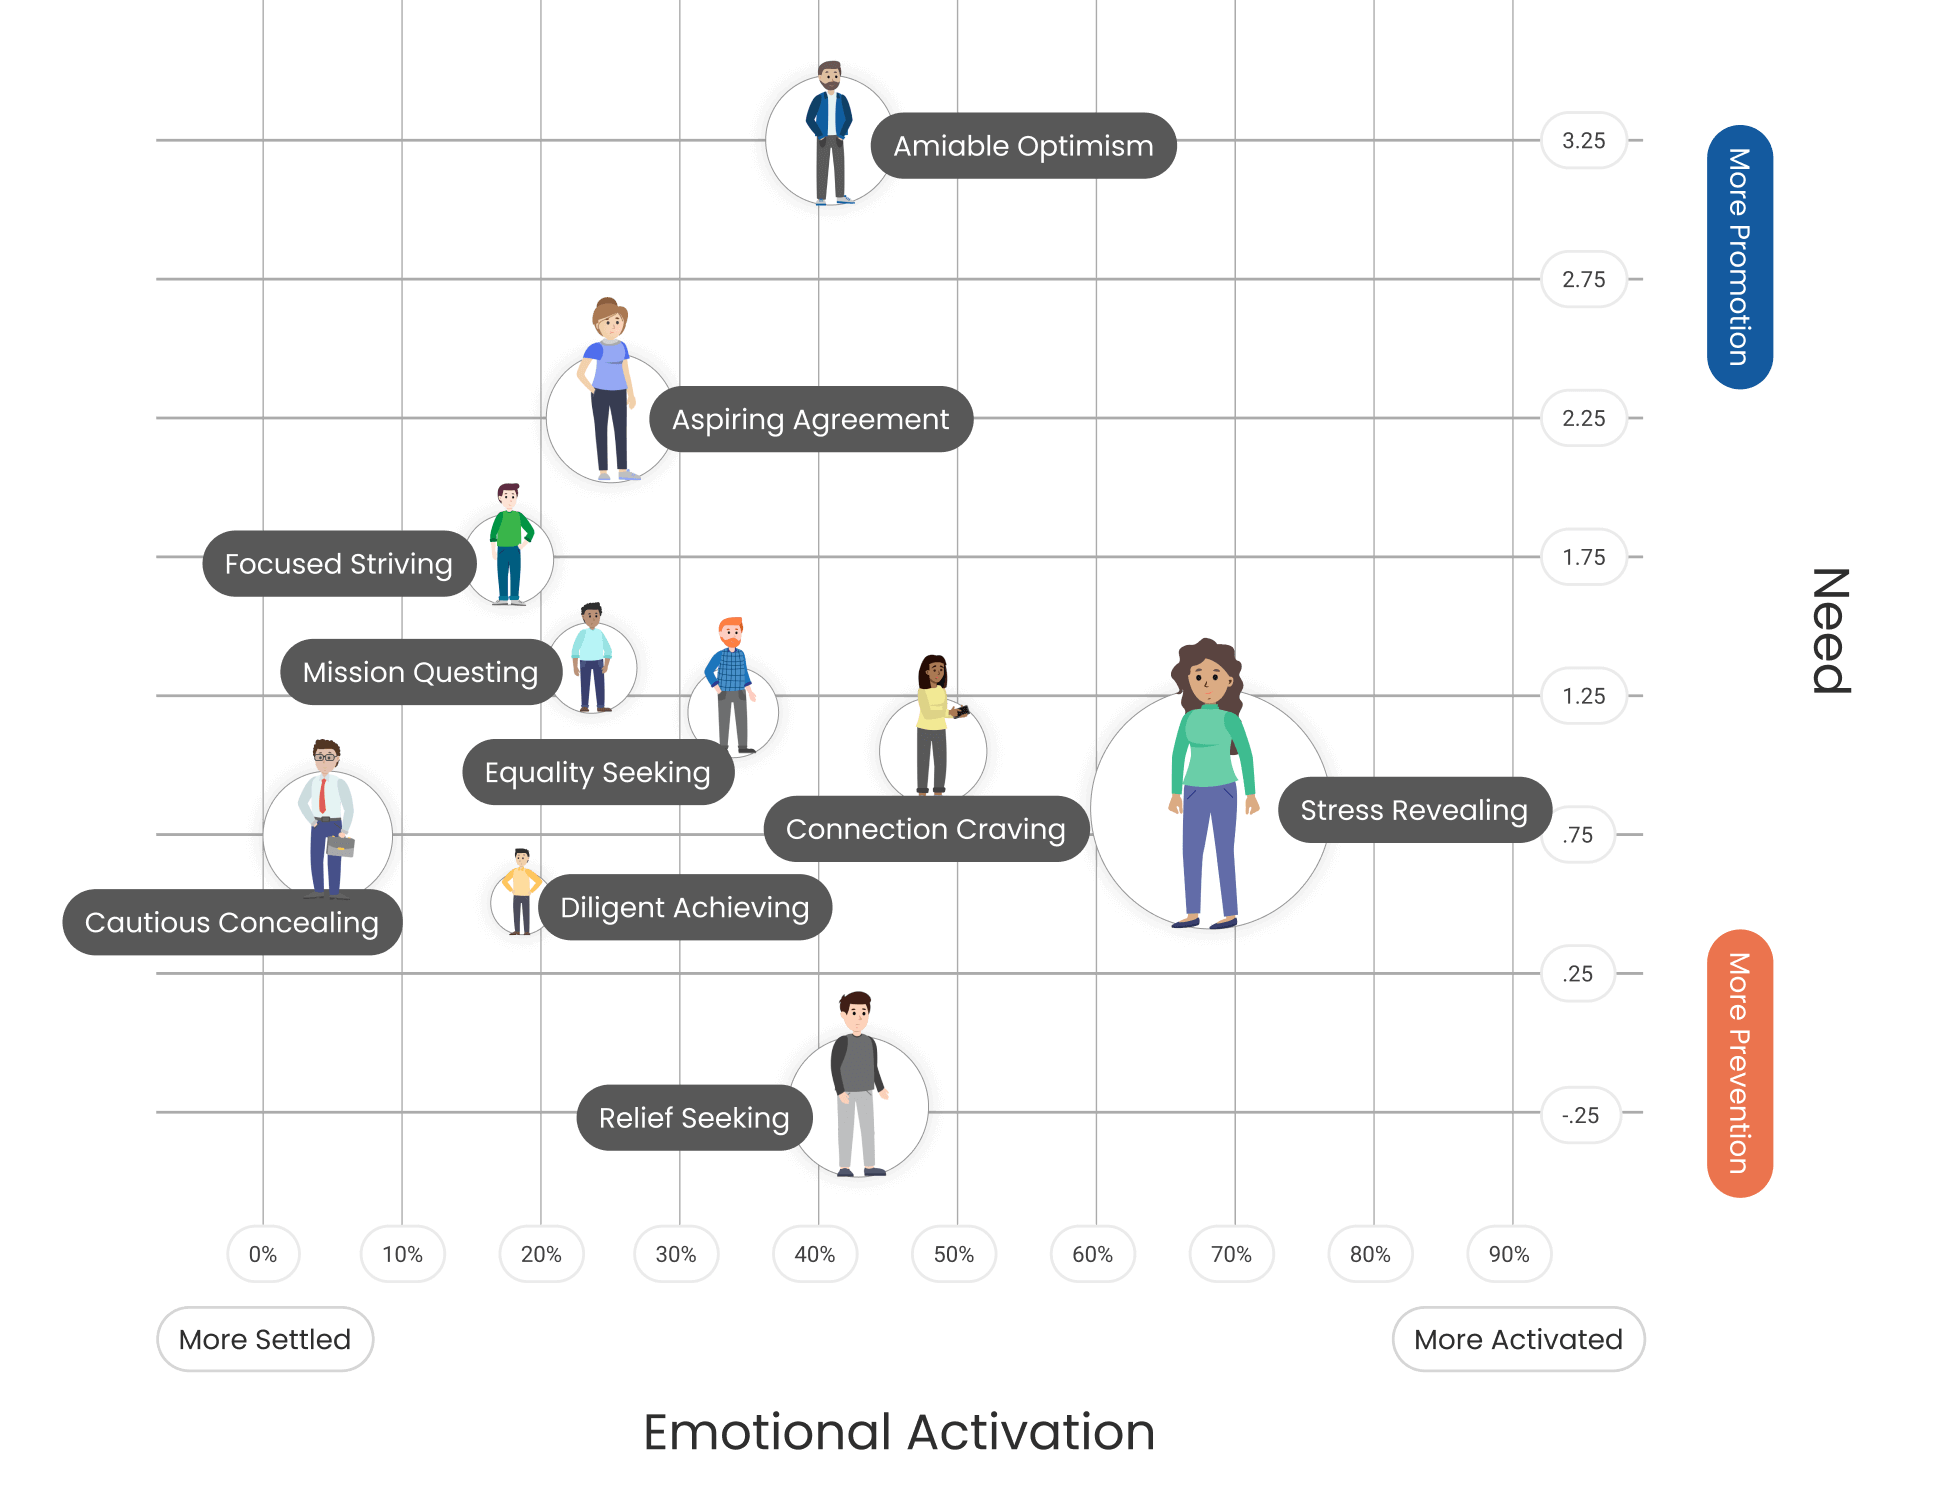
Each individual’s AgileBrain profile is unique, reflecting their specific emotional state at the time and for the specific focusing prompt. Indeed, if you do the math, there are over 620 septilian possible patterns (more than the total gallons of water on the Earth!). AgileBrain 10 States uses cluster analysis to reduce that effectively infinite profiles into ten distinct patterns of emotions. The chart below at left shows those 10 states arrayed by activation (x-axis) and positivity or valence (y-axis).
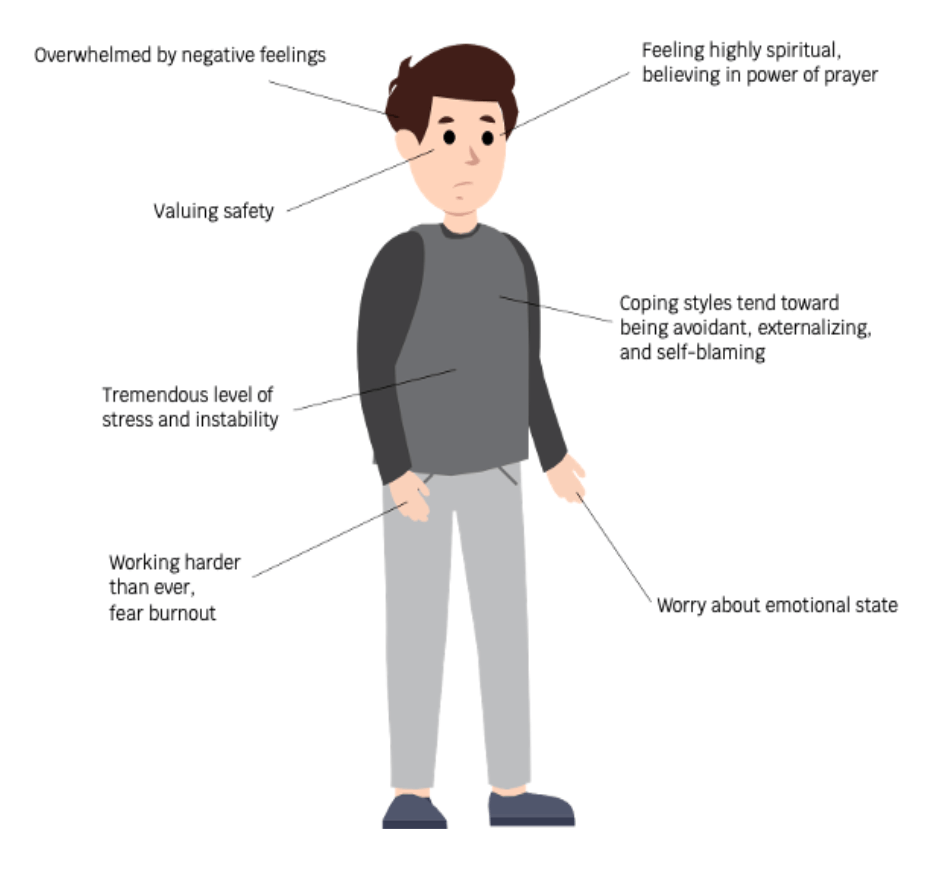
The chart below shows those same 10 states with the pattern of activation and positivity within the AgileBrain Framework associated with each. In each case, the size of the bubble represents the relative size of the population in that state. So, for example, Stress Revealing is one of the largest bubbles (about 19% of the population) and located to the right, indicating high Activation. It is relatively low in the chart, indicating one of the lowest Positivity scores. Finally, stress revealers are particularly activated in the Self Domain (left-most column in the Framework) and the Spiritual Domain (right most column), and keeping with their negativity, 5 of the 7 total activated need cells are negative (orange in this illustration).
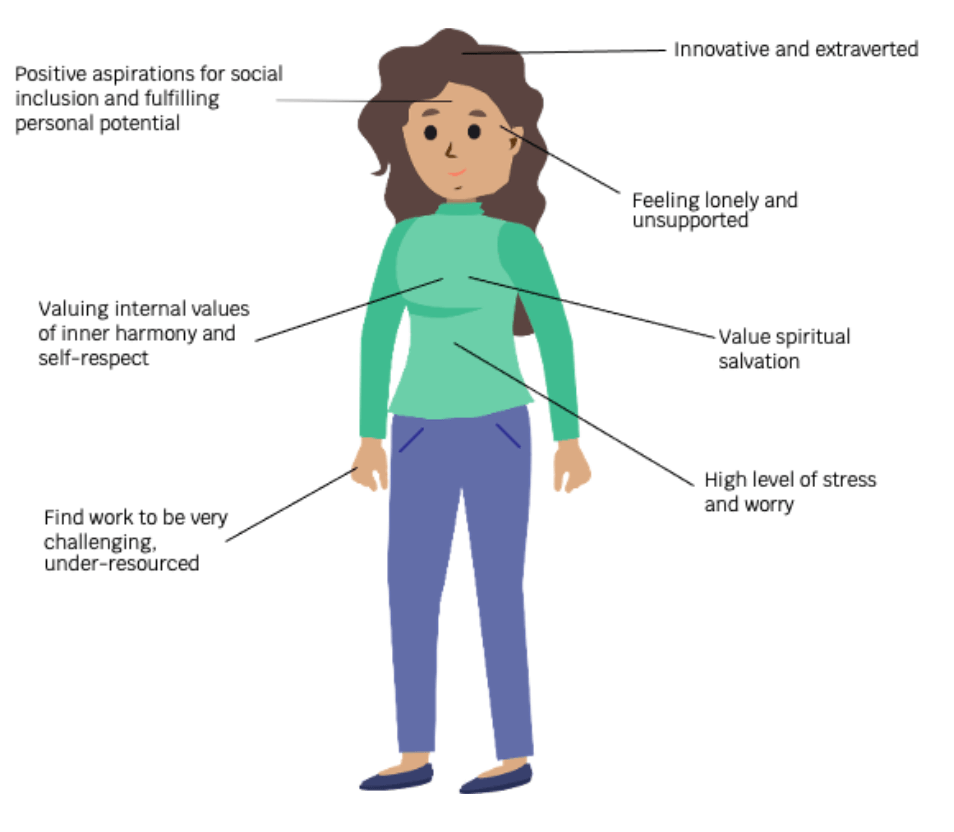
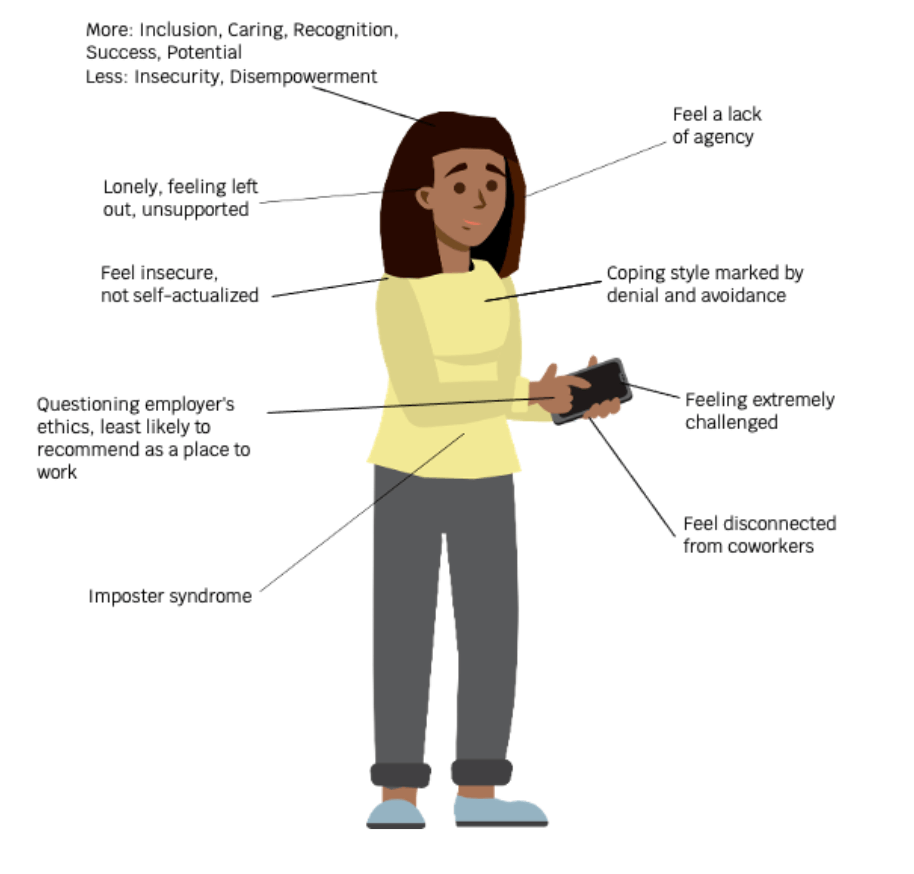
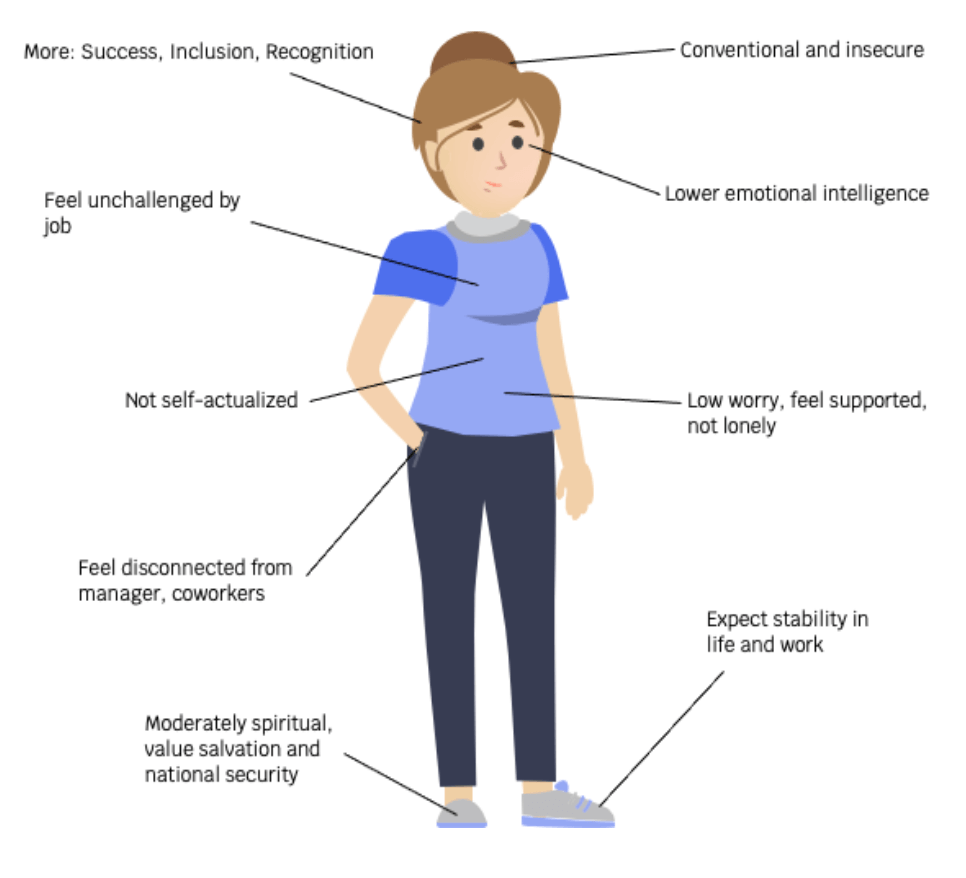
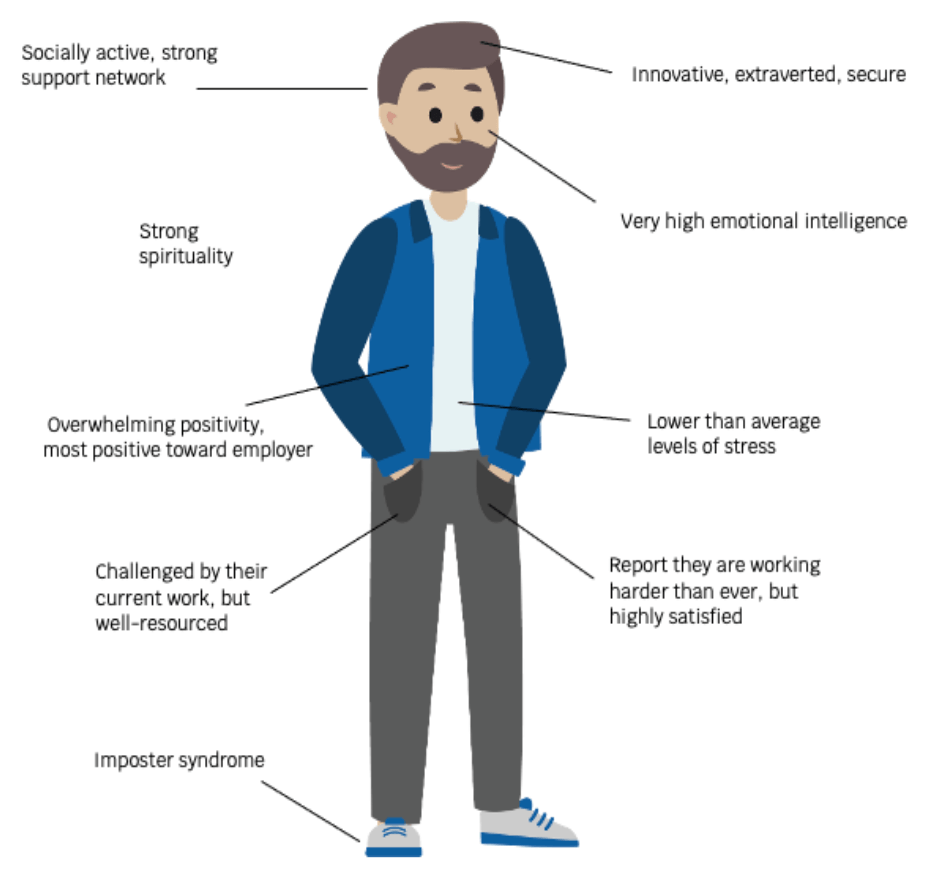
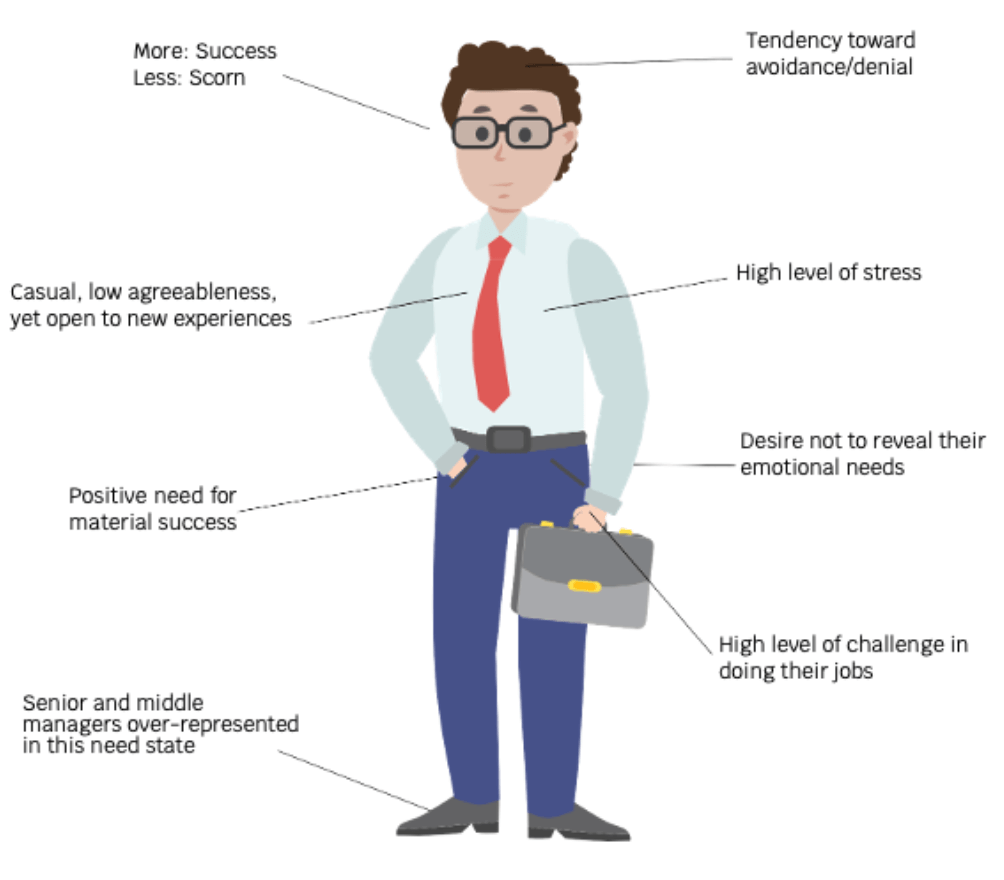
At Leading Indicator Systems, we regularly run large-scale validation studies for AgileBrain. Each time we ask respondents additional questions on a wide range of social-emotional topics. Since we know the AgileBrain 10 State for these study respondents, we can run statistical analyses that “load” those social-emotional data onto the AgileBrain 10 States that best fit. The AgileBrain 10 State Profile for Stress Revealing illustrates how we gather additional insight about individuals to assist them and their coaches and counselors as well as to drive insight at the organizational level to inform administrators about deeper issues that may be affecting the wellbeing of their population.
Important to Note